
How can an investor effectively use the CAPE ratio? One of the secrets to stock market success is the price paid for a stock. Buying at the top of a market when valuations are stretched will typically lead to lower returns. Conversely, buying at the bottom of a market cycle can lead to market beating returns.
Sounds easy but most people cannot do it. They cannot do it because they either will not or cannot remove their emotions from their investment decisions.
It is very difficult to go against the crowd and be a buyer of downtrodden countries or stocks when everyone else is selling or advocates selling. It makes sense because our chimpanzee brain is telling us “danger stay away you could get hurt”.
This is part of our primal survival instinct. Our brain is saying stay with the herd and your chances of survival are higher than going it alone. However we are in search of market beating returns not surviving a sabertooth tiger attack.
What Is The CAPE Ratio?
What if there was a tool that would help an investor to decide if a market was cheap or expensive. What if the tool has been been back tested and proven to be effective in determining if a market is cheap or expensive. What if using this tool leads to market beating returns. Would you use it?
The CAPE ratio or Cyclically Adjusted Price to Earnings is a valuation measure used for determining the relative valuation of various stock markets. It was created and published by Nobel Laureate Robert Shiller. Basically the higher the number on the scale the lower the expected future return. Here is a chart with the CAPE ratio for the US going back to 1881:

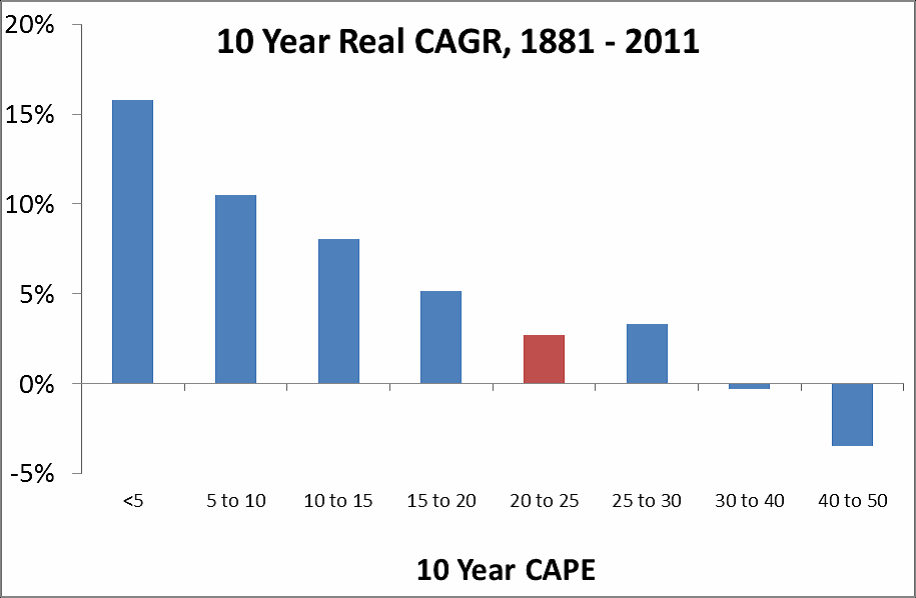
Below is chart that shows the 10 year return on US stocks versus the CAPE:
I got this information from a recent book by Med Faber entitled “Global Value” which I encourage you to read and which he gives away for free on his site. I actually encourage folks to read all of Mr. Faber’s books as I have found him to be one of best finance/investment writers I have read.
What this chart shows is that the higher the CAPE ratio that a market is trading at the lower the expected returns will be over the next 10 years. This of course makes perfect sense as the higher the CAPE ratio the more expensive the market tends to be.
Because stocks represent actual ownership interest in an operating company this concept makes perfect sense. When you buy stock in a company you are buying a portion of the income that the company can generate over a period of years.
This has a value but is affected by other factors; interest rates, overall economy, industry fundamentals, technology, politics, etc.… Therefore if you overpay for a stock your potential return will very likely be lower over the ensuing years.
On the flip side of the coin if temporary events such as an overall market decline or recession lowers the cost of the stock then the future returns are going to worth more.
Serious investors approach the stock market by saying to themselves, “If I could buy the entire company based on the current stock price does the cost make sense? Will the business be able to throw off enough cashflow to make it worth my investment dollars and the risk? Can the return beat risk free assets like Treasury bills and bonds?”
Why Most investors fail?
Most individual investors do not do this and it is one of the main reasons their investment returns cannot even match the market averages. Individual investors mostly invest based on emotion or their gut. They read an article in a so called “financial’ publication and think “that sounds like a good idea” or worse yet listen to a guy like Cramer.
The ubiquity and ease with which investors can setup a brokerage account just enables this activity.
No work is put into actually analyzing the actual business from a financial perspective. In addition, not understanding where in the market cycle one finds themselves is another big problem. I know everyone touts being a long term investor but not many individual investors are long term investors. When the portfolio is down 30-50% they usually sell and cement in their poor performance.
If an investor had bought at the top of the market in 1929 and suffered through the crash he would have had to wait 25 years to just get back to even! Who in the real world would sit and wait for 25 years. No one I know and certainly not today’s individual investor.
The CAPE ratio prior to the crash was at a reading of 30 and was at a level that indicated that future returns would be substandard. The crash happened and the CAPE went from 30 to 5 which was a historic buying opportunity.
How To Use The CAPE Ratio?
The way to use this tool then is to calculate the CAPE ratio for various markets around the world which will then give an investor an idea which markets are over valued or undervalued. The investor could then do something as simple as buying an ETF for the undervalued countries and holding until the country becomes fairly valued again. Luckily there are few sites that do that for you already here and here.
One of the knocks against using the CAPE ratio is that it is not a market timing tool. For example, the CAPE ratio is currently indicating that the current stock market in the US is overvalued. In fact, it is the most overvalued except for two other times. One being right before the Great Depression in 1929 and the other being the 1999-2000 Tech wreck. The current market has been overvalued on A CAPE basis for a couple of years and if one would have followed just the CAPE ratio they would have missed out on these gains.
Answers to CAPE Ratio Critics
I have two answers to that criticism. The first is that anyone that is just limiting themselves to the US market is going to underperform me over time. The CAPE ratio is calculated for many countries around the world. The principles of buying low valuation and selling over valuation work everywhere. The correct action would have been selling into the US overvaluation and deploying capital into undervalued markets.
The second answer to the criticism of using CAPE is that even if an investor just wanted to trade in the US they could use trend following methods and/or stop loss strategies to mitigate their risk. Just waving your hand and saying the CAPE ratio is over rated and doesn’t work is short sighted and plain wrong in my view.
Just about every advocate of CAPE that I am familiar with has stated that CAPE is not a market timing tool. It is a tool to gauge relative valuation and using it in a worldwide context has shown demonstrable ability to beat the overall passive index investing model.
The CAPE ratio is not a 100% set and forget tool and it is not a market timing tool. Nothing is guaranteed in investing and speculating. However it has demonstrated itself as a fairly accurate tool that can be used as a starting point in identifying historically cheap markets which can then be researched further for opportunities.
If you want to get rich you cannot just haphazardly throw darts at the stock page. You must have a plan and demonstrably useful tools to limit risk while also enhancing your returns. The CAPE ratio is one of the tools I use to help me beat the market averages.